One data integration platform, built to overcome any challenge
Automate and manage data pipelines. Enable business users with live, high-quality data. Stay in full control. On-premise, in cloud or hybrid.


Power-up your
productivity
Reduce costs, give back time to your busy teams, and add a layer of trust to your data with automated transformations and repeatable templates.

Overcome your data challenges with one platform
Handle mission-critical processes and complex data jobs with ease, and cater to your business’s diverse data needs with one integrated product.

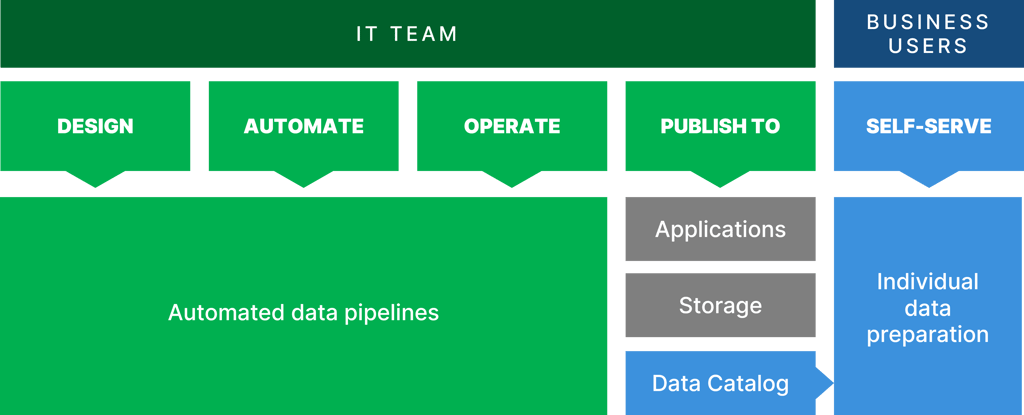
Empower everyone,
not just IT
Get the best of both worlds: control and accessibility. Put your developers in the drivers seat, all while allowing your business users to access and self-serve relevant data.

Rely on CloverDX’s expertise
Get the most out of your investment. Benefit from CloverDX’s extensive training and consultation packages, as well as a dedicated customer support team.

‘CloverDX was one of the best investments we ever made, it’s still paying dividends. What it's enabled us to do has been pretty phenomenal’


Responding reactively to your data challenges?
It’s time to get the upper hand. Identify your biggest sticking points and learn how to mitigate them.
Adopt an automation-first approach
And see the benefits. Discover how CloverDX can streamline data validation, error handling, file manipulation and more.
Let our platform
do the talking
Request a demo of CloverDX today and we'll show you how our platform can improve your end-to-end data processes.
